Respect the Bean: How a Rapid Increase in Soybean Exports Drives Fed Policy. Really.
On Friday, we got the first (advance) estimate of Q3 economic growth for the U.S. The estimate, which is based primarily on data from the first month of the quarter, registered 2.9% on an annualized basis. Not bad, you say? Evidence of a bounce back? You need a coffee.
Add the 2.9% estimate to 1.4% for the Q2 and 1.1% for Q1 and divide by three. The average annualized GDP growth for the first three quarters of this year is...1.8%. Not good.
But we do not recommend that you accept the pre-election Q3 estimate. Why? The move higher was driven by a jump in inventory (already far too high) and exports (despite a slowing world economy). The key sectors of the economy continued to show weakness. Real Consumer Spending rose 2.1% Q/Q, far below the anomalous 4.3% spike in Q2 and missing estimates of a 2.6% print. Furthermore, the key capital spending picture remains depressed. Fixed Investment in the U.S. has now declined for a fourth consecutive quarter, subtracting 0.1% from Q3 GDP.
So, what drove Q3 growth? Would you believe an increase in soybean exports accounted for 0.9% of the real growth for the entire U.S. economy in Q3, just about one-third of total growth?
Seasonally adjusted annualized (SAAR) consumer spending was far from robust, as this chart shows.

Fixed Investment meanwhile invites comparison with recessions past.

On an annualized basis, GDP rebounded fractionally from last quarter's 1.3%, rising just 1.5% compared to one year ago.

This is supposed to be the kind of economic performance that will drive the Fed confidently into a rate increase in December?
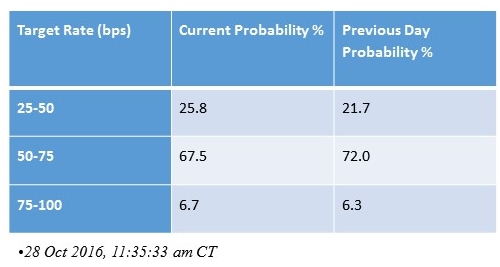
The CME Group publishes 30-Day Fed Fund futures prices which have long been used to express the market's views on the likelihood of changes in U.S. monetary policy. CME's Group FedWatch tool calculates the probability of FOMC rate moves for upcoming meetings. Here is the data for October 28, 2016 which predicts a 67.5% likelihood of a 0.25% rate hike in December and a 25.8% likelihood of no rate hike at that time.
The gap between real economic performance and rate hike expectations is very large. No doubt the Fed feels the need to hike to preserve what little credibility it has left. That seems to be what the market is thinking. But unless we expect soybean exports to continue to soar, the economic numbers simply do not justify higher rates.
However, let's suppose the Fed pulls the trigger. History shows that gold negatively anticipates rate increases and then responds positively when the rate hikes occur...just as we saw with the Fed hike of December 16, 2015, the first hike in nearly 10 years. That rate hike marked the beginning of a very strong rally in gold. The following charts demonstrate that there is no historical correlation between Fed rate hikes and lower gold prices.

In the 1970s, a rapidly rising price of gold went along with skyrocketing interest rates. In January of 1970, you could buy an ounce of gold for $36.56. By December 1979, the price was up to $593.84, a 16-fold increase. More than half of this gain occurred from 1977-1979 when the price rose from about $132 to $594 while the interest rate on the 1-year Treasury Note more than doubled from under 5% to almost 12%.
Here is a graph from Monetary Metals overlaying the gold price with the Fed Funds Rate.
